An article appearing in Molecular Psychiatry . The punchline? The more you smoke, the thinner your cortex is.
Of course, this study didn't randomize people to smoke or not; they asked them about their smoking history. And many things affect cortical thickness and might be related to smoking and thus need to be accounted for before causality is inferred. The authors adjusted for age, gender, cholesterol, blood pressure, strokes, cardiovascular disease, alcohol intake, diabetes, IQ at age 11, among several others.
Impressive, right? Is your favorite confounder on the list? It's pretty easy to criticize any observational study for failing to account for a confounder -- mine is "mojo" which is notoriously difficult to measure accurately.
But when the confounder is on the list, we feel better. We assume that, if the authors say they adjusted for it, they adjusted for it. We can ignore it. That confounder is gone.
Here's the thing ... adjustment is a lie.
But to understand why, we need to delve a bit into the philosophical side of statistics.
Underpinning all of statistics is the idea that any two measurable factors are linked, in some sort of Platonic ideal, by a mathematical relationship. This relationship is distorted by randomness, error, noise-in-the-system. But since that noise is random, it distorts the relationship randomly, not systematically. Therefore, the more data points we measure, the more signal to the noise, the more clear that magical underlying relationship becomes. By measurement, we interpret the mathematical structure of the data, allowing us to compress the relationship into a simple mathematical formula. That formula is what is used when we "adjust" our results.
I think an example is in order.
In honor of my dad, we are going to examine the link between age and ability to use a smartphone. Since this is an exercise, I'm using simulated data.
For the purpose of this simulation, we're going to imagine that the underlying mathematical relationship between age and smart phone ability is linear and negative, like this:
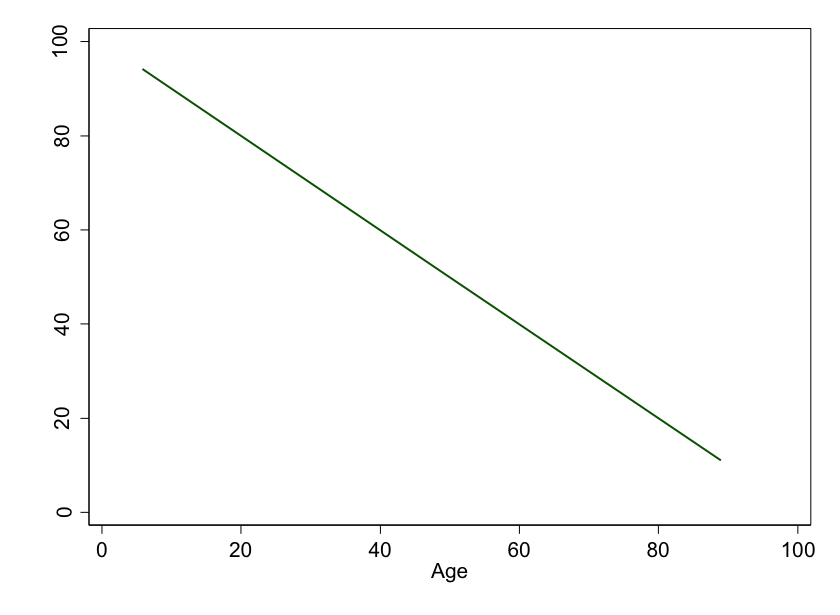 Figure 1: Age versus ability to use a smart phone. In this idealized world, every year older leads to the same reduction in smart phone ability.
See? The older you are, the worse your ability to use that miracle device is.
But we're scientists. We need data. Here, I've simulated 10 individuals, of varying ages, with various smart phone ability scores.
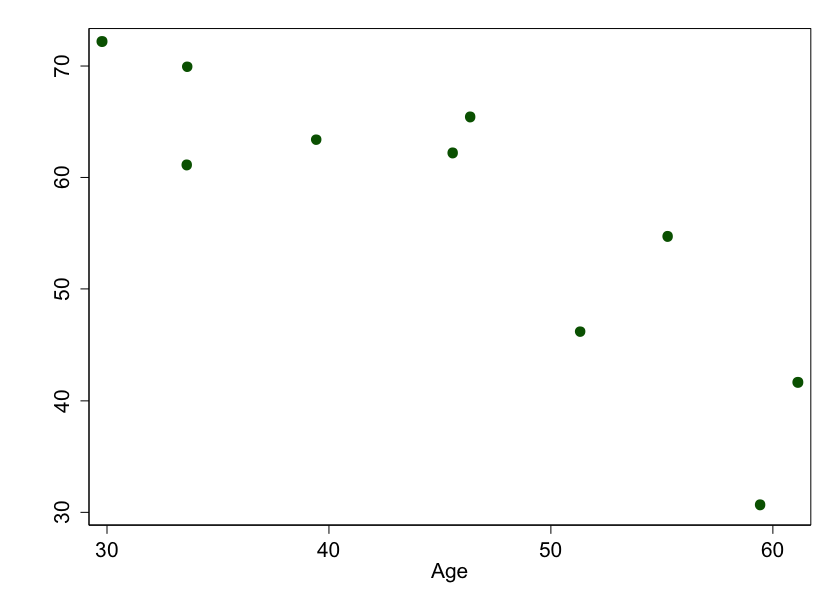 Figure 2: Age versus ability to use a smart phone. These are results we might get if we picked 10 random people to measure, and the “true†relationship was linear.
Why don't these points fall on a line? Because of random error. Remember, the real world is not the .
But the more we measure, the closer we get to the truth:
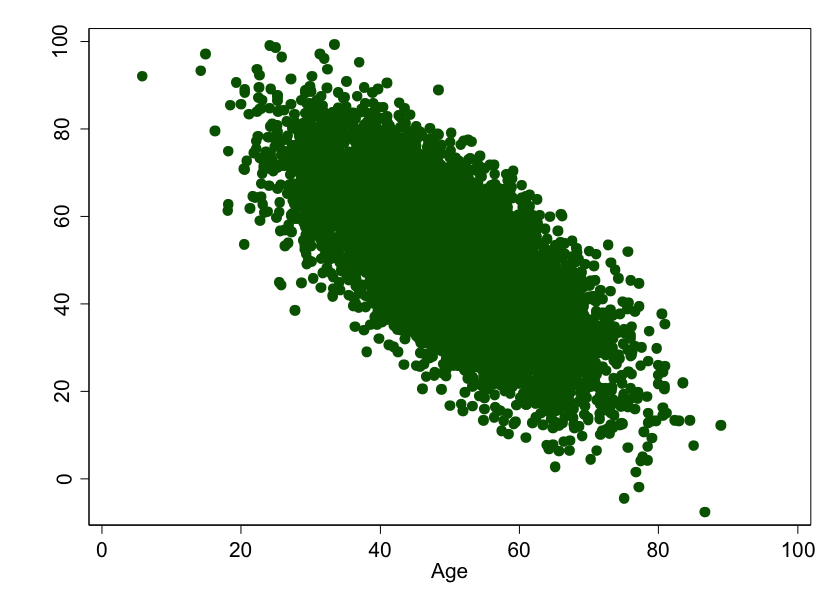 Figure 3: Age versus ability to use a smart phone. This is what we might expect if we picked 10,000 people to measure, and the underlying relationship was linear.
See? This is why sample size is important. With all this data, we can estimate what the relationship is, and we'll be pretty close to the truth. Stats types call this estimate a "model" and, in this case, the model we'd build is a simple linear one: For every year increase in age, smart phone ability goes down by about 1 point.
But what if the underlying, beautiful, Platonic mathematical relationship isn't linear? What if it looks like this:
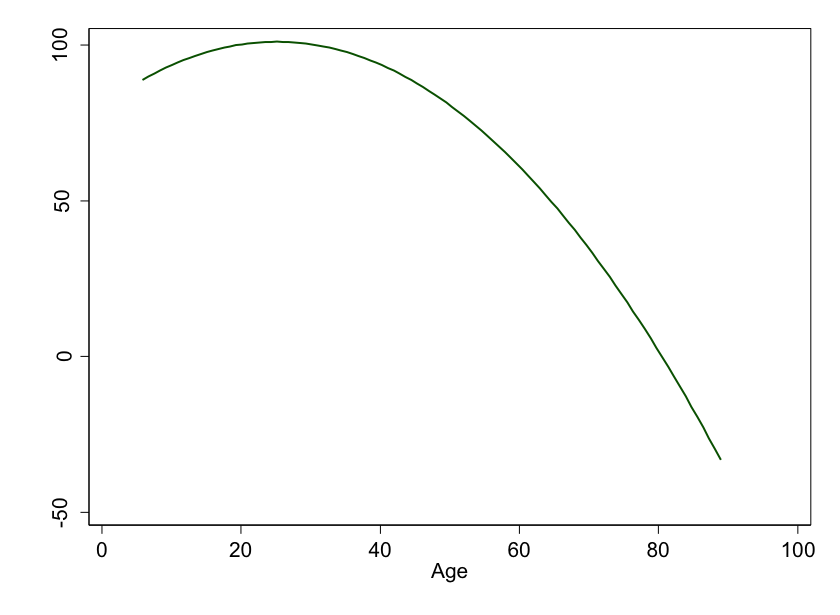 Figure 4: Age versus ability to use a smart phone. In this idealized world, as you age, you lose your smart phone skills faster and faster…
We, of course, need to actually make measurements. Here's what 10 random people look like, assuming the truth is something curved:
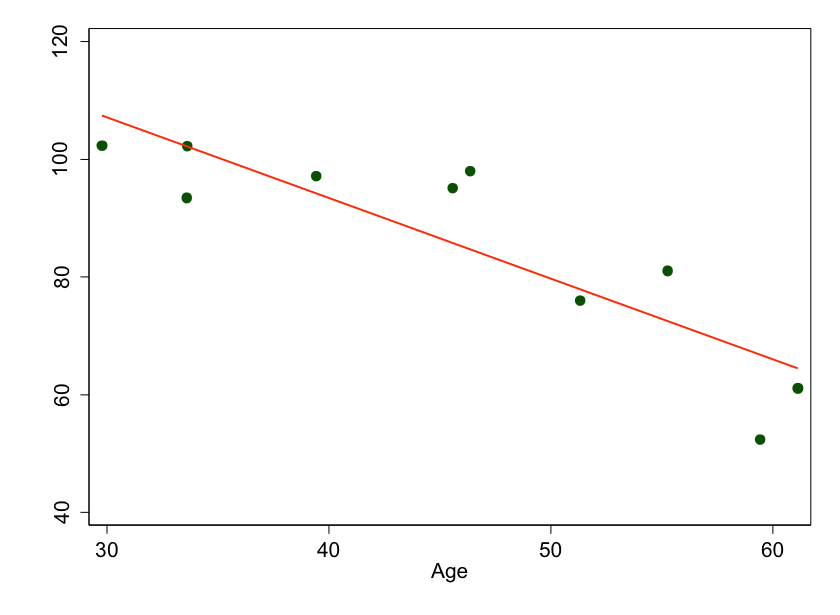 Figure 5: We measured ten random people and fit a nice line to the points, but we’re missing the underlying curve because we don’t have enough data.
This time I've added a line of best fit to the graphs. It's still pretty close, but we aren't quite modeling the data appropriately. I can write an equation for the line, but if I account for that relationship in my subsequent analyses, I will not be adjusting completely for age.
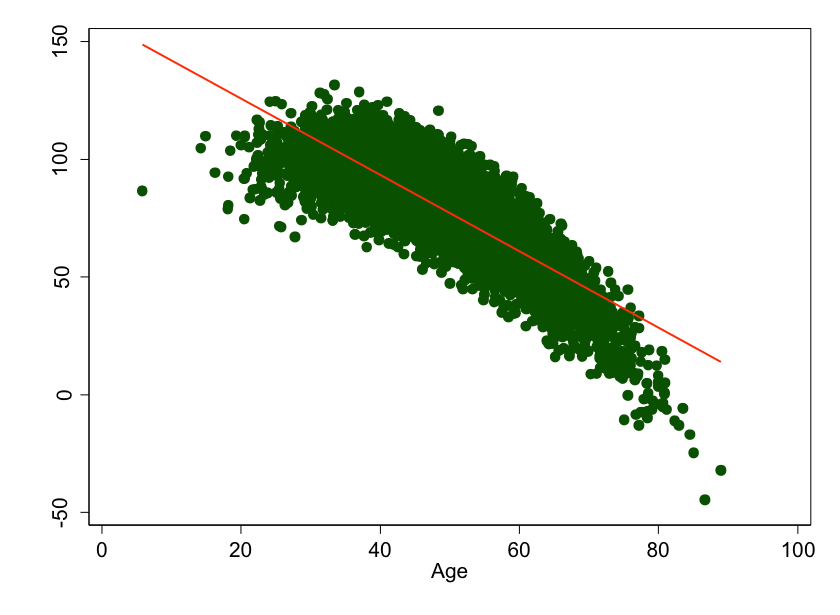 Figure 6: Age versus smart phone ability, assuming the underlying relationship is curved. You’d think a statistician looking at this data would be sure to fit a curve to this data, not a line. You’d be wrong.
And that's the crucial point. When a writer says "we adjusted for <some factor>," you should ask "how?" More often than not, it's a simple linear adjustment. And few things in biology are actually linear.
Now, I don't mean to pick on the study in Molecular Psychiatry. I don't have their data. I applaud them for actually telling us that they assumed an underlying linear relationship between their covariates and cortical thinning -- most authors would just say "we adjusted for X" and leave it at that. And I fully, completely, buy the argument that smoking is bad for your brain. I could have chosen literally any observational study -- even my own -- because we all engage in overly simple modeling.
A caveat for statisticians: yes, you can overfit your models. I'm not saying we have to use machine-learning or neural networks to perfectly capture every nuance of the data. But we should be aware of this problem, look for it, and be careful when we blindly trust that things were "adjusted."
Note that these problems are moot if you're looking at a randomized trial. This is one of the reasons why randomized trials are considered the highest quality of evidence.
So be careful out there. Adjustment is a tool, and it can be applied with carelessness or artistry. As always, look at the results -- if they are consistent with prior evidence and biology, everything is probably fine. When you see something that really shocks you, look closer -- you may find that the devil is in the details. And the details are in the methods.
The Methods Man is . He earned his BA from Harvard University, graduating with honors with a degree in biochemistry. He then attended Columbia College of Physicians and Surgeons in New York City. From there he moved to Philadelphia to complete his internal medicine residency and nephrology fellowship at the Hospital of the University of Pennsylvania. During his research time, Wilson also obtained a Masters of Science in Clinical Epidemiology from the University of Pennsylvania. He is an accomplished author of many scientific articles and holds several NIH grants. If you'd like to see more of his work, please visit him at or follow .